Adding A Second Dimension
What happens if another variable is added to the description of these cells?
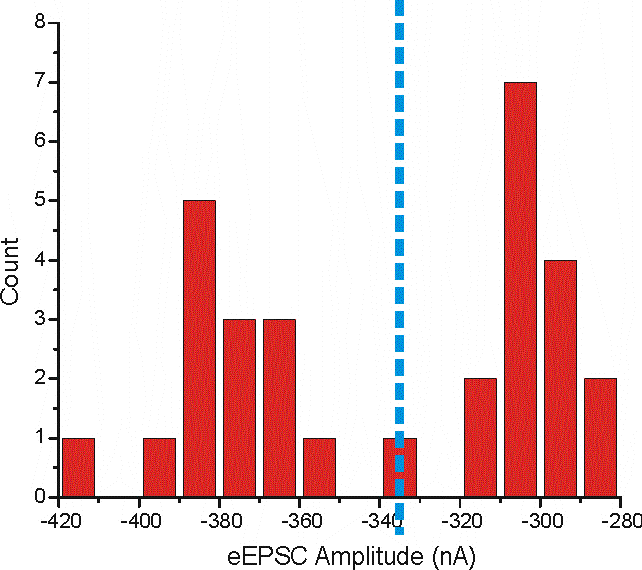
One other variable is the evoked EPSC amplitude. By itself eEPSC amplitude plotted as a histogram looks like this:

Two distributions of data are more easily seen here. However there is a problem in deciding which group the cell with an eEPSC amplitude of between -330 and -340 pA belongs to.
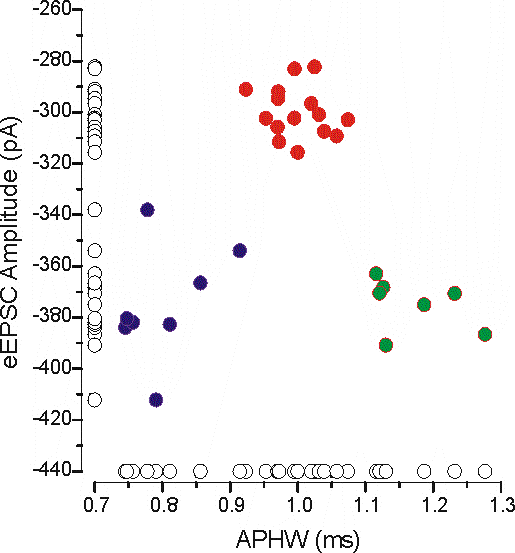
Like people these cells can't be described fully by just one dimension though. A much better description is made by combining these 2 variables together (APWH and eEPSC amplitude).

Plotted on each axes are the variables individually (APHW on the X, eEPSC on the Y).
It can be seen much more easily now that there in fact at least three groups of cells described by just two variables. Perhaps even more could be seen if a 3rd variable (dimension) were added to describe these cells.
Here's a rotatable 3D plot of APHW, eEPSC with the addition of membrane time constant (MTau). By moving the graph around now 4 distinct groups of dots (cells) can be seen. You may have to download a plugin if you don't have Microsoft Java Virtual Machine installed (which is no longer supported by MS anyway, MS wants to kill JAVA by 2007 or something I guess). To get a plugin go to Sun Microsystems for the download.
| user action | applet reaction |
|---|---|
| dragging (left mouse button pressed) | rotating about an axis in the picture |
| releasing left mouse button while dragging | spinning about an axis in the picture |
| pressing SHIFT key plus vertical dragging | zooming |
| pressing SHIFT key plus horizontal dragging | rotating about an axis perpendicular to the picture |
| pressing CONTROL key plus vertical dragging | changing focal length |
| pressing CONTROL key plus horizontal dragging | changing strength of stereo effect |
| pressing META (ALT) key (or right mouse button) plus vertical dragging | stripping parts of the graphics |
| pressing "o" key | printing parameter settings to the Java console (a.k.a. Java messages window) |
| pressing "s" key | toggling between single picture, stereo pictures for diverge fusing, and stereo pictures for cross fusing |
This 3D graph is great to visualize that there are 4 different clusters. That doesn't mean that there only 4 clusters though. By adding more dimensions more clusters could be revealed. Imagine if the 3D graph were a movie with time as the 4th dimension, there could be clusters appearing at the same location but at different times revealing additional groups.
This of course becomes a bit tedious as well. You'll have to pick which variables (parameters) are represented by dimensions and you're limited to seeing only 3 or possibly 4 dimensions at a time. Cluster analysis is able to 'see' clusters in an infinite number of dimensions or 'n'-dimensional space where 'n' is the number of variables.
NEXT: How to actually measure similarities or dissimilarities between objects (cells).